
Here I outline some of the specific projects that I am leading to increase our current knowledge on exoplanets as well as to maximize the scientific return of the future ESA/NASA space missions.
P1: ExoTETHyS (Tools for Exoplanetary Transits around Host Stars)
ExoTETHyS is an open-source package for modeling exoplanetary transits, eclipsing binaries and related phenomena.
The first release focuses on tools for modeling the stellar limb-darkening effect, the importance of which is ubiquitous in transit observations, as well as in optical interferometry, microlensing and eclipsing binary observations. It contains two subpackages:
- SAIL (Stellar Atmosphere Intensity Limb), i.e., a new calculator of stellar limb-darkening coefficients that outperforms the existing software by one order of magnitude in terms of light-curve model accuracy, down to <10 parts per million (ppm);
- TRIP (Transit Ring-Integrated Profile), i.e., an exact transit light-curve generator based on the entire stellar intensity profile rather than limb-darkening coefficients. Following requests by users, I am adding a function to model eclipsing binaries.
A detailed description of the intended use of the package and its performances is reported in the reference paper (Morello et al., in press). The software has been reviewed by two referees of The Journal of Open Source Software (JOSS). The latest stable versions are released each time on PyPI and Zenodo.
Currently, I am supervising two PhD students (expecting a few more) who are developing tools for modeling and correcting other contaminating effects in transit observations:
- Student 1 has investigated the potential bias due to neglecting the exoplanet nightside emission in transit observations, updating the formula of Kipping & Tinetti 2010 for the nightside pollution with an additional term. The bias can be significant especially for short-period planets in the thermal infrared, e.g., JWST/MIRI and NIRSPEC observations (paper, in prep.). We will also provide the algorithm for modeling this effect based on the system parameters and observing wavelengths.
- Student 2 is working on an algorithm to correct the effect of stellar activity in transit spectroscopy, starting from the ARIEL simulations.
Future work will include development of new tools or upgrade of the existing ones for modeling other phenomena, such as exoplanet and star tidal deformations, rotational oblateness and gravity darkening, the presence of exomoons and exorings.
P2: SEA BASS (Stellar and Exoplanetary Atmospheres Bayesian Analysis Simultaneous Spectroscopy)
This project is strictly related with P1, but it focuses on the development of optimal strategies to break model degeneracies in the time series analysis at multiple wavelengths. To date, I have demonstrated an algorithm that enables simultaneous fitting of the transit depth (exoplanetary atmosphere) and limb-darkening coefficients (stellar atmosphere) with increased precision and accuracy compared to the most common approaches, also avoiding, in some cases, very strong biases (Morello et al., 2017; Morello, 2018).
Both the exoplanet and stellar communities will benefit from a reanalysis of archive data by using this approach. The same methodology (with some upgrades) will enable consistent analysis of the exoplanetary transits observed with PLATO, TESS and/or CHEOPS and their spectroscopic counterparts observed with JWST and ARIEL. I foresee the contribution of a few PhD students and young postdocs on this project.
P3: The Sun as an exostar
The Sun is the only star of which we can observe the surface in great detail. This opportunity allows us to directly measure the intensity distribution of the solar disk and to identify with certainty the astrophysical phenomena causing variations of the solar flux (occultations, spots, faculae, granulation). I am analyzing various images of the transits of Venus with a dual approach, i.e., by using all the spatial information or just the flux integrated on the solar disk. This study aims to validate the various assumptions made in the analysis of exoplanet transits and to test additional diagnostics to make more robust analyses.
P4: Revisiting Spitzer/IRAC data with Independent Component Analysis
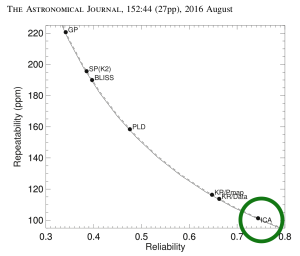
During my PhD I have developed unsupervised data detrending algorithms based on Independent Component Analysis (ICA). ICA is a blind source separation technique with a long record of successful applications in many fields. Among these algorithms, the wavelet pixel-ICA turned out to be one of the most reliable and repeatable to detrend Spitzer/IRAC time series (Ingalls et al. 2016).
The reanalyses of two HD189733 b and four GJ436 b have determined that the transit depth did not vary by more than 100 ppm (Morello et al. 2014, 2015), contrary to earlier estimates that led to questions of stellar variability (Bealieu et al. 2008, 2011; Désert et al, 2009, 2011; Knutson et al. 2011).
The reanalysis of three WASP43 b phase-curves (Morello et al. 2019) also led to reduced variability and better agreement with theoretical models of the exoplanet atmosphere compared to the original study by Stevenson et al. 2017.
Now I am reprocessing the Spitzer/IRAC archive data, as well as some private data, with the wavelet pixel-ICA method to confirm/update the (un)published results. This task is part of the Horizon 2020/ ExoplANETS-A project (PI: Pierre-Olivier Lagage).
I also intend to release a public version of the pixel-ICA software.
P5: Complete & Consistent Analyses
The idea is to carry out complete and consistent analyses of all datasets to characterize an exoplanet, including transit/eclipse/phase-curve and high-resolution Doppler spectroscopy. The C&C analyses will maximally leverage the information contained within each dataset and combine low and high-spectral resolution information contents. Here I show a preliminary scheme, solely based on the current facilities and archive data:
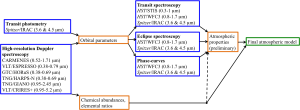
We rely on transit photometry and high-resolution Doppler spectroscopy to obtain independent estimates of the orbital parameters, then combining them into a joint prior for the subsequent analyses. Transits observed with Spitzer/IRAC are first choices, because of the reduced degeneracy between orbital parameters and stellar limb-darkening in the IR. The prior estimates of orbital parameters are essential to avoid spurious spectral trends that can mimic the effect of particle scattering or broad molecular features. We compute transmission and emission spectra from UV/visible to IR, then perform consistent retrievals. If phase-curves are also available, they can be taken into account in the consistent retrievals. Note that some software development is needed to enable fitting the fully self-consistent models, e.g. by coupling the retrieval algorithms with deep convolutional generative adversarial networks to speed up the likelihood sampling (Zingales & Waldmann 2018). A temporary solution can be running independent transit/eclipse/phase-curve retrievals and then joining the posterior distributions of the retrieved atmospheric parameters. The information obtained from high-resolution Doppler spectroscopy can be injected as bayesian prior for the consistent retrievals, or a posteriori following the example of Brogi & Line 2019.
Based on some preliminary tests, we expect to measure the absolute abundances of the main carbon and oxygen-bearing molecules (H O, CO, CO and CH
 ), metallicity down to <0.5 dex and C/O down to 0.1 dex in a handful of exoplanet atmospheres before the launch of the JWST. The observed exoplanet chemistry will be compared with the predictions from different formation and evolutionary models (Oberg et al. 2011; Turrini et al. 2015; Mordasini et al. 2016; Booth et al. 2017; Ali-Dib 2017; Eistrup et al. 2018), providing the first empirical constraints on the possible scenarios. Knowledge of the age of the system, along with orbital eccentricity and obliquity can help to further constraining the possible formation and evolution pathways (Chatterjee et al. 2008; Esposito et al. 2017).
P6: TESS/PLATO automated classification
The ongoing TESS mission, and later on PLATO (expected launch in 2026), will provide photometric light-curves of tens of million stars. Their primary objective is to reveal the transiting exoplanets in our Galaxy. We need automated pipelines to identify transit-like signals in the raw data and to distinguish the true planetary transit events from the false positives. The importance of a reliable classification pipeline to be orders-of-magnitude faster than human vetting is increased by the need of selecting the best targets for the ARIEL reference sample within about 2 years after the launch of PLATO, and the hunt for temperate and/or rocky planets the atmospheres of which can be characterized with the upcoming JWST.
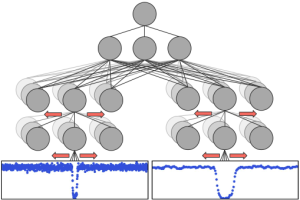
with Kepler data. Probably, the main source of confusion comes from blended eclipsing binaries, which are more frequent in the TESS data because of its 21” pixel scale (Kepler pixel scale was 3.98” ). The PLATO pixel scale is 15”.
I envision a list of upgrades to boost the AstroNet-TESS/PLATO performances, among which (1) incorporating knowledge from the science images and stellar catalogs as input; (2) carefully selecting the most useful input information and its format (e.g., size and sampling of the global and local views); (3) modifying the output layer to compute the probabilities that the input object belongs to different classes. Simpler classification tools can be used for quickly testing the impact of the changes to the original network.